Steel Canyon Golf Club

Public Executive Sandy Springs, Georgia Mapped from OpenStreetMap
Map of Steel Canyon Golf Club: 18 holes drawn from OpenStreetMap over the USGS lidar relief, north up 1 2 3 4 5 6 7 8 9 10 11 12 13 14 15 16 17 18 0 100 200 yd

Swipe the map sideways to see the whole course.

  • Fairway
  • Green
  • Tee
  • Bunker
  • Water
  • Cart path
  • Ground, low to high
North up. Numbers sit behind each tee; tap one to jump to the hole. Golf features © OpenStreetMap contributors (ODbL), OSM data fetched 2026-09-27. Terrain: USGS 3DEP 1 m lidar.
Holes18
Par61
Par 3s12of 18
Mapped length3,897ydAlong the hole lines, not the card
Relief173ft860 to 1,033 ft above sea level
Footprint103acres

An executive course off Morgan Falls Road, open to the public: twelve par 3s, five par 4s and one par 5, par 61, packed into about a hundred acres on a hillside.

Everything on this page comes from two open datasets, the golf features mapped in OpenStreetMap and the USGS 1 m lidar grid of the ground, and from our own rounds. Nothing comes from the course’s website, a golf app or a yardage book. The hole signs name three tees, Black, White and Red. The course’s scorecard gives every hole’s yardage from the Black and the White, 3,799 and 3,375 yards; the Red is known only on 16, from its sign.

Why I like it

I really enjoy this executive course, and a lot of that is the scenery. The ground moves: real elevation change, which we’ve measured, mostly on the first seven holes. Almost everywhere you look it looks like a Windows XP wallpaper, which I love.

There aren’t many trees on the early holes, which is good and bad. Holes 8, 11 and 12 are pretty much surrounded by them.

It isn’t the most pristinely maintained course, but it does a very good job against other public courses, though I’m too new to the game to speak to that well. The carts are gas, the driving range is fantastic and has a ball tracking system, and it’s a great value.

Photographs

From our rounds

Taken on the day and placed where the watch was. The course as it looked then, which is not a claim that it still does.
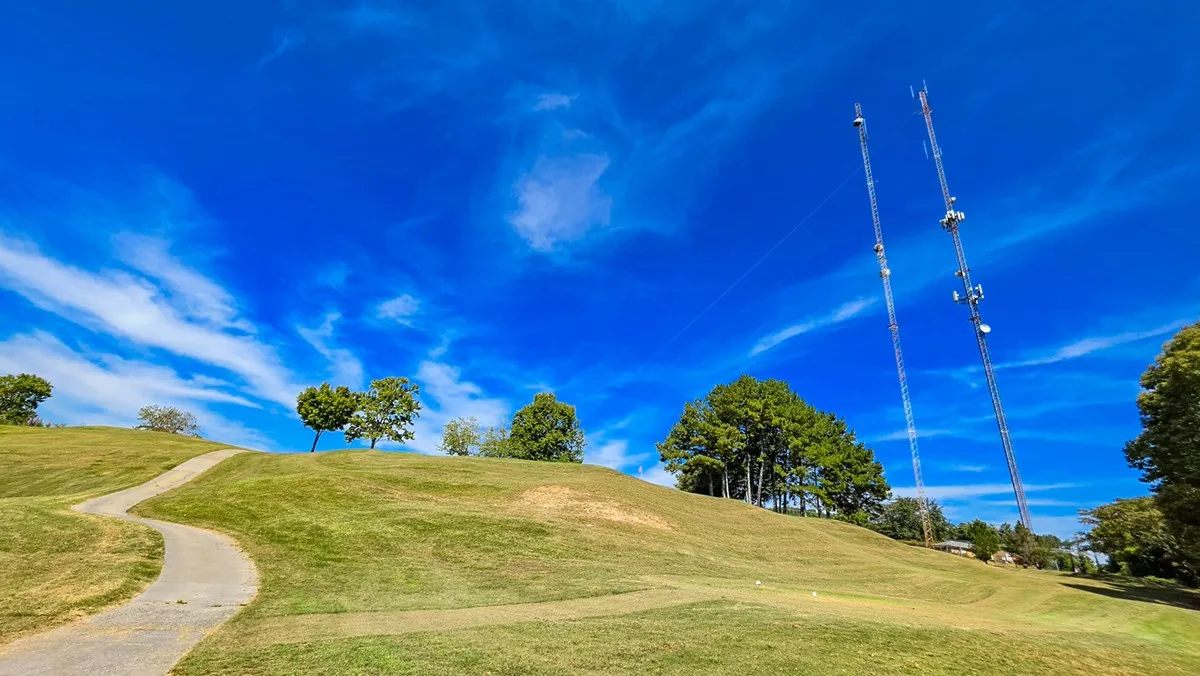
Hole 7 tee, September 30, 2026
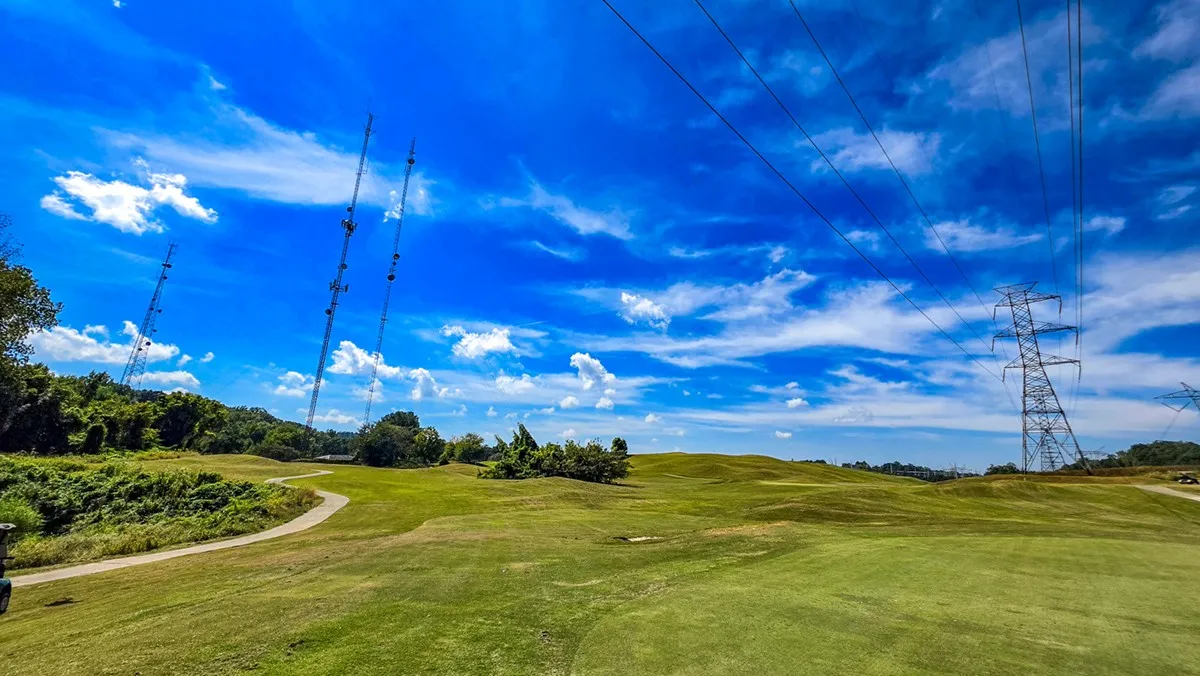
Hole 9 green, September 30, 2026
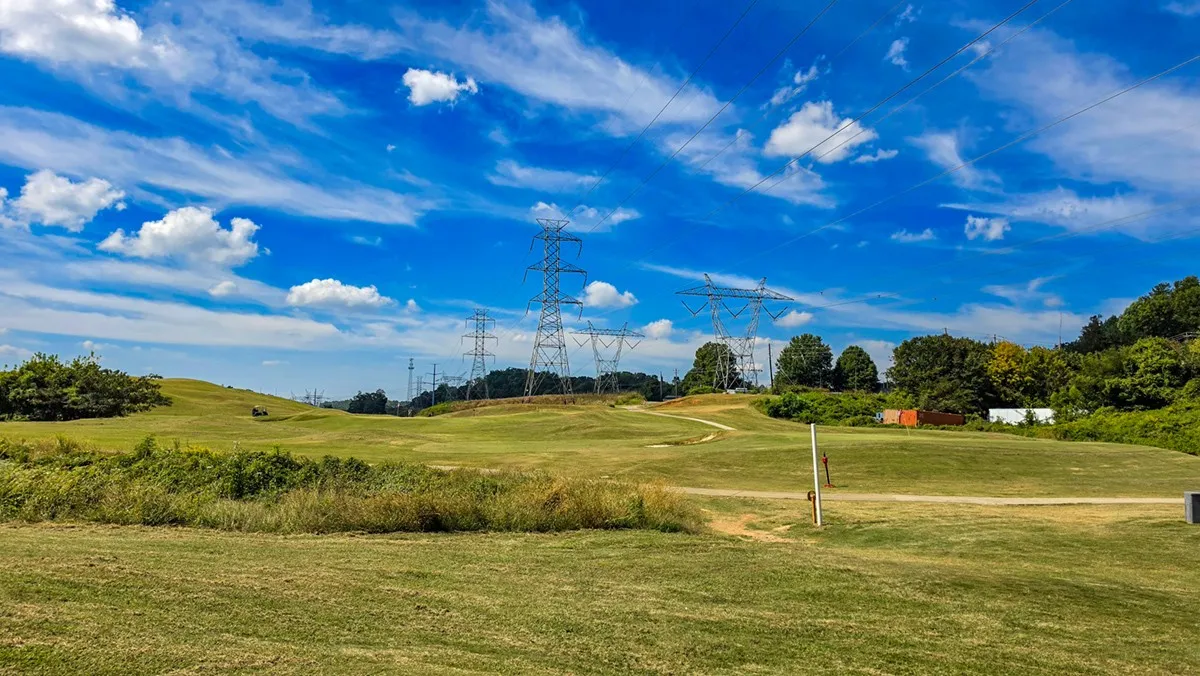
Hole 12 tee, September 30, 2026
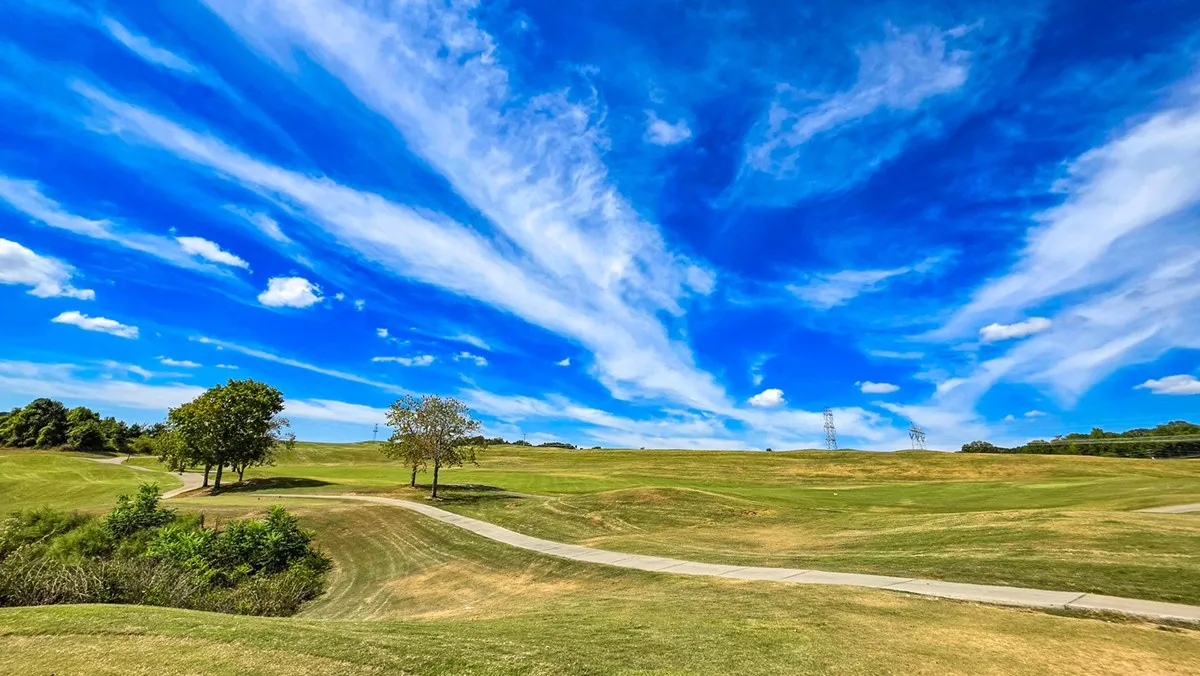
Hole 14 tee, September 30, 2026
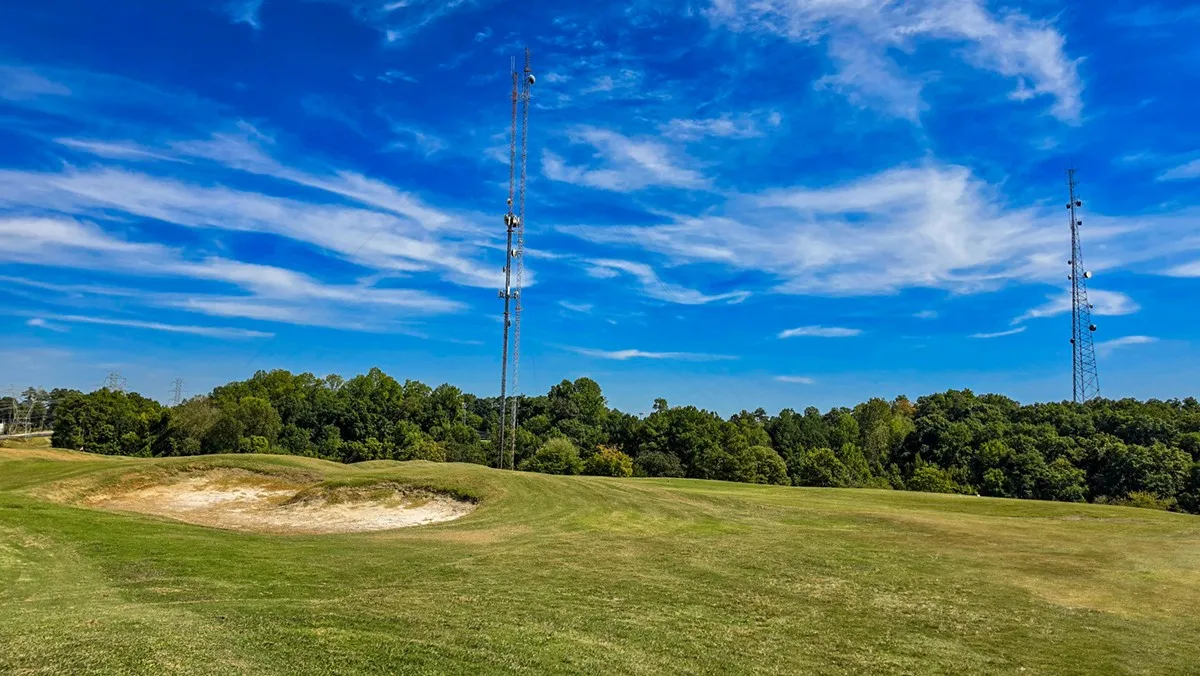
Hole 16 green, September 30, 2026
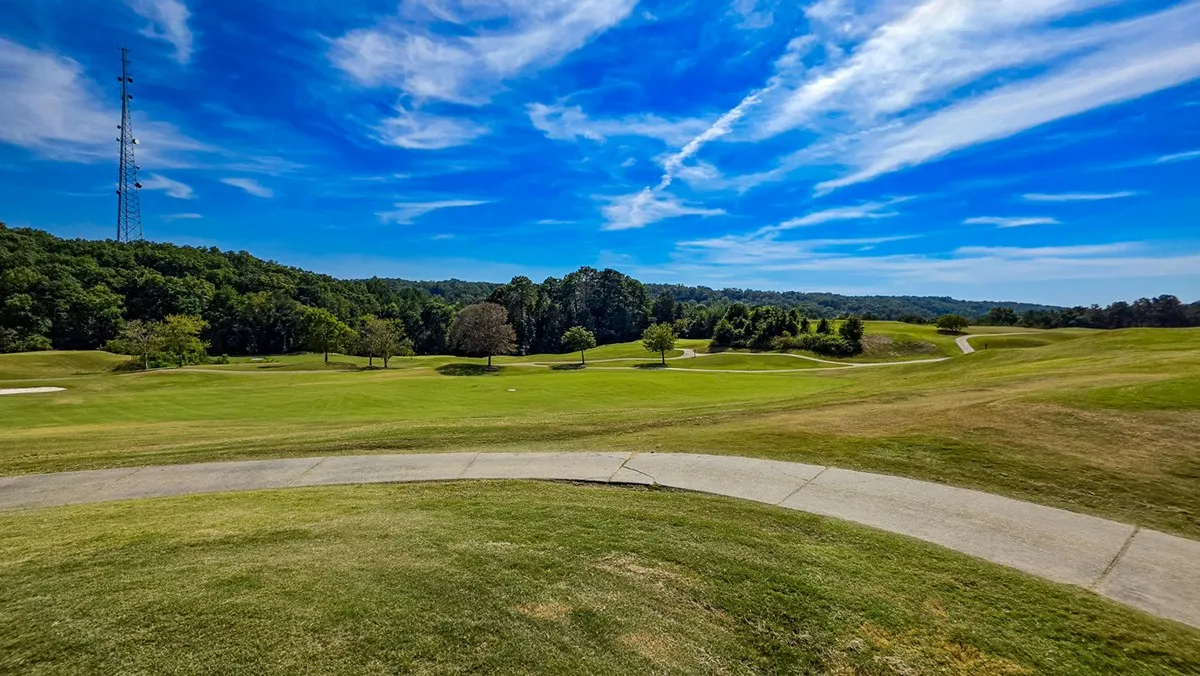
Hole 17 tee, September 30, 2026
Measured before the first round

What the ground says

Four things the lidar and the map show about this course, worked out from the data rather than read off a brochure.

Biggest drop 63ft

Hole 4 falls that far from the tee end of its line to the green.

Most tilted green 6.2%

Hole 5, falling to the west. A soft finding: the outline may take in some collar, and a round will confirm it.

Greens 4,260sq ft

The median green, from 2,800 to 5,460 square feet as mapped.

One swing to hit the green 12of 18

Par 3s, where a green in regulation is the tee shot.

Explore

The course in 3D

The same lidar and the same map, raised into a model you can turn and tilt. Tap a flag, or the Fly this hole button on any hole card below, to follow a hole from behind the tee down to the green.

Steel Canyon in three dimensions: turn it, tilt it, zoom in, and fly any hole from the tee to the green.

318 KB on a computer, 169 KB on a phone. Needs WebGL2; nothing loads until the tap.

Terrain: USGS 3DEP 1 m lidar, drawn on a 2 m grid on a computer (479,136 triangles) and 4 m on a phone, at 1.5x vertical scale, with a faint contour every 10 ft. A flight draws the hole it follows from the 1 m grid on a computer and the 2 m grid on a phone (a computer also takes the colors at 0.25 m a pixel, 247 KB), and follows the hole as OpenStreetMap maps it, tee end to green, never a ball. Fairways, greens, tees, bunkers, water and cart paths from OpenStreetMap (© OpenStreetMap contributors, ODbL), the fairways striped along each hole for looks, not from a mowing record. Lit from the northwest, 42° up, the cartographers' convention.
Every hole, tee to green

The ground under the round

Ground profile of all 18 holes from the lidar, tee to green, in playing order 900 ft 925 ft 950 ft 975 ft 1,000 ft 1,025 ft 1 P4 2 P4 3 P3 4 P3 5 P3 6 P5 7 P3 8 P3 9 P3 10 P3 11 P4 12 P3 13 P3 14 P3 15 P4 16 P4 17 P3 18 P3
Ground along each mapped hole line from the USGS lidar, tee end to green end. Hole widths are true to length; height is stretched about 19 times so the slopes show. Gaps are the walks between holes, drawn once a round records them. Tap a hole to jump to it.
Hole by hole

The 18 holes

Each hole turned to play up the page, drawn from the map over the lidar. The arrow on the green shows the way it falls. Yardage comes from the course's scorecard, tee by tee.

Hole 1 drawn from OpenStreetMap over the lidar relief, tee at the bottom, green at the top 100 yd

Hole 1

Par4

Black tee
317yd
White tee
289yd
Stroke index
3
Tee to green
36ft down
Green
4,880sq ft
Green tilt
1.9% to the south
TeeGround along the lineGreen
Hole 2 drawn from OpenStreetMap over the lidar relief, tee at the bottom, green at the top 100 yd

Hole 2

Par4

Black tee
279yd
White tee
257yd
Stroke index
5
Tee to green
54ft down
Green
4,650sq ft
Green tilt
2.9% to the north
TeeGround along the lineGreen
Hole 3 drawn from OpenStreetMap over the lidar relief, tee at the bottom, green at the top 50 yd

Hole 3

Par3

Black tee
121yd
White tee
100yd
Stroke index
15
Tee to green
3ft up
Green
3,570sq ft
Green tilt
1.0% to the northwest
TeeGround along the lineGreen
Hole 4 drawn from OpenStreetMap over the lidar relief, tee at the bottom, green at the top 50 yd

Hole 4

Par3

Black tee
187yd
White tee
171yd
Stroke index
9
Tee to green
63ft down
Green
4,210sq ft
Green tilt
4.4% to the south
TeeGround along the lineGreen
Hole 5 drawn from OpenStreetMap over the lidar relief, tee at the bottom, green at the top 50 yd

Hole 5

Par3

Black tee
123yd
White tee
103yd
Stroke index
17
Tee to green
10ft up
Green
4,370sq ft
Green tilt
6.2% to the west
TeeGround along the lineGreen
Hole 6 drawn from OpenStreetMap over the lidar relief, tee at the bottom, green at the top 100 yd

Hole 6

Par5

Black tee
501yd
White tee
486yd
Stroke index
1
Tee to green
15ft down
Green
5,460sq ft
Green tilt
5.0% to the southwest
TeeGround along the lineGreen
Hole 7 drawn from OpenStreetMap over the lidar relief, tee at the bottom, green at the top 50 yd

Hole 7

Par3

Black tee
155yd
White tee
135yd
Stroke index
11
Tee to green
14ft down
Green
3,750sq ft
Green tilt
2.3% to the south
TeeGround along the lineGreen
Hole 8 drawn from OpenStreetMap over the lidar relief, tee at the bottom, green at the top 50 yd

Hole 8

Par3

Black tee
185yd
White tee
145yd
Stroke index
7
Tee to green
12ft up
Green
4,450sq ft
Green tilt
3.0% to the south
TeeGround along the lineGreen
Hole 9 drawn from OpenStreetMap over the lidar relief, tee at the bottom, green at the top 50 yd

Hole 9

Par3

Black tee
153yd
White tee
125yd
Stroke index
13
Tee to green
Level
Green
3,440sq ft
Green tilt
1.3% to the south
TeeGround along the lineGreen
Hole 10 drawn from OpenStreetMap over the lidar relief, tee at the bottom, green at the top 50 yd

Hole 10

Par3

Black tee
137yd
White tee
113yd
Stroke index
12
Tee to green
7ft up
Green
4,080sq ft
Green tilt
2.2% to the south
TeeGround along the lineGreen
Hole 11 drawn from OpenStreetMap over the lidar relief, tee at the bottom, green at the top 100 yd

Hole 11

Par4

Black tee
293yd
White tee
254yd
Stroke index
4
Tee to green
18ft down
Green
3,610sq ft
Green tilt
1.2% to the south
TeeGround along the lineGreen
Hole 12 drawn from OpenStreetMap over the lidar relief, tee at the bottom, green at the top 50 yd

Hole 12

Par3

Black tee
138yd
White tee
127yd
Stroke index
16
Tee to green
12ft down
Green
2,800sq ft
Green tilt
5.9% to the west
TeeGround along the lineGreen
Hole 13 drawn from OpenStreetMap over the lidar relief, tee at the bottom, green at the top 50 yd

Hole 13

Par3

Black tee
95yd
White tee
89yd
Stroke index
18
Tee to green
4ft up
Green
4,300sq ft
Green tilt
1.1% to the east
TeeGround along the lineGreen
Hole 14 drawn from OpenStreetMap over the lidar relief, tee at the bottom, green at the top 50 yd

Hole 14

Par3

Black tee
170yd
White tee
148yd
Stroke index
8
Tee to green
1ft down
Green
4,090sq ft
Green tilt
2.3% to the southeast
TeeGround along the lineGreen
Hole 15 drawn from OpenStreetMap over the lidar relief, tee at the bottom, green at the top 100 yd

Hole 15

Par4

Black tee
301yd
White tee
270yd
Stroke index
6
Tee to green
8ft up
Green
5,430sq ft
Green tilt
5.3% to the west
TeeGround along the lineGreen
Hole 16 drawn from OpenStreetMap over the lidar relief, tee at the bottom, green at the top 100 yd

Hole 16

Par4

Black tee
351yd
White tee
333yd
Red tee
316yd
Stroke index
2
Tee to green
9ft up
Green
4,710sq ft
Green tilt
1.9% to the west
TeeGround along the lineGreen
Hole 17 drawn from OpenStreetMap over the lidar relief, tee at the bottom, green at the top 50 yd

Hole 17

Par3

Black tee
140yd
White tee
114yd
Stroke index
14
Tee to green
4ft down
Green
4,750sq ft
Green tilt
1.8% to the north
TeeGround along the lineGreen
Hole 18 drawn from OpenStreetMap over the lidar relief, tee at the bottom, green at the top 50 yd

Hole 18

Par3

Black tee
153yd
White tee
116yd
Stroke index
10
Tee to green
1ft down
Green
2,990sq ft
Green tilt
1.4% to the south
TeeGround along the lineGreen
Played here

Rounds at Steel Canyon

Conditions

Latest reports

Only what was measured or written down on the day: green speed off a stimpmeter, firmness, bunkers, aeration, cart path only. No report is not the same as good conditions.

No condition reports yet

They come from the scorecards, one per round.

Sources

Where these numbers come from

Golf features

Holes, par, stroke index, greens, tees, fairways, bunkers, water and cart paths from OpenStreetMap, © OpenStreetMap contributors, under the Open Database License. Four volunteer mappers drew the golf detail, mostly in 2022. Anything renovated since the mapping may not show.

Terrain

USGS 3D Elevation Program, 1 m lidar, from Georgia's 2018 statewide flight, public domain. Hole profiles are the ground along each mapped hole line. Green tilt is a plane fitted to the ground inside each mapped green; a tilt of 5% or more is a soft finding until a round confirms it.

What is not here

No imagery or yardages from the course's website, golf apps or yardage books. No shot tracking: where people walked, never where a ball went. The mapped length of a hole is not its card yardage.